Where, when and among whom does BAY cholera strike? These patterns shape what a trigger should watch and at what spatial unit.
3.1 Epidemic curves by state
Show code
fig, axes = plt.subplots(3, 1, figsize=(11, 7.5), sharex=True)for ax, st inzip(axes, U.STATES): d = sw[sw["state"] == st] ax.fill_between(d["week"], d["cases"], color=U.STATE_COLORS[st], alpha=0.85) ax.set_title(st, loc="left", color=U.STATE_COLORS[st]) ax.set_ylabel("cases/wk") ax.axvspan(pd.Timestamp("2020-01-01"), pd.Timestamp("2020-12-31"), color=U.HDX["gray"], alpha=0.15)axes[-1].xaxis.set_major_locator(mdates.YearLocator())axes[-1].xaxis.set_major_formatter(mdates.DateFormatter("%Y"))fig.suptitle("Weekly suspected cholera cases by state (2018–2023)", fontweight="bold", x=0.01, ha="left")plt.tight_layout()plt.show()
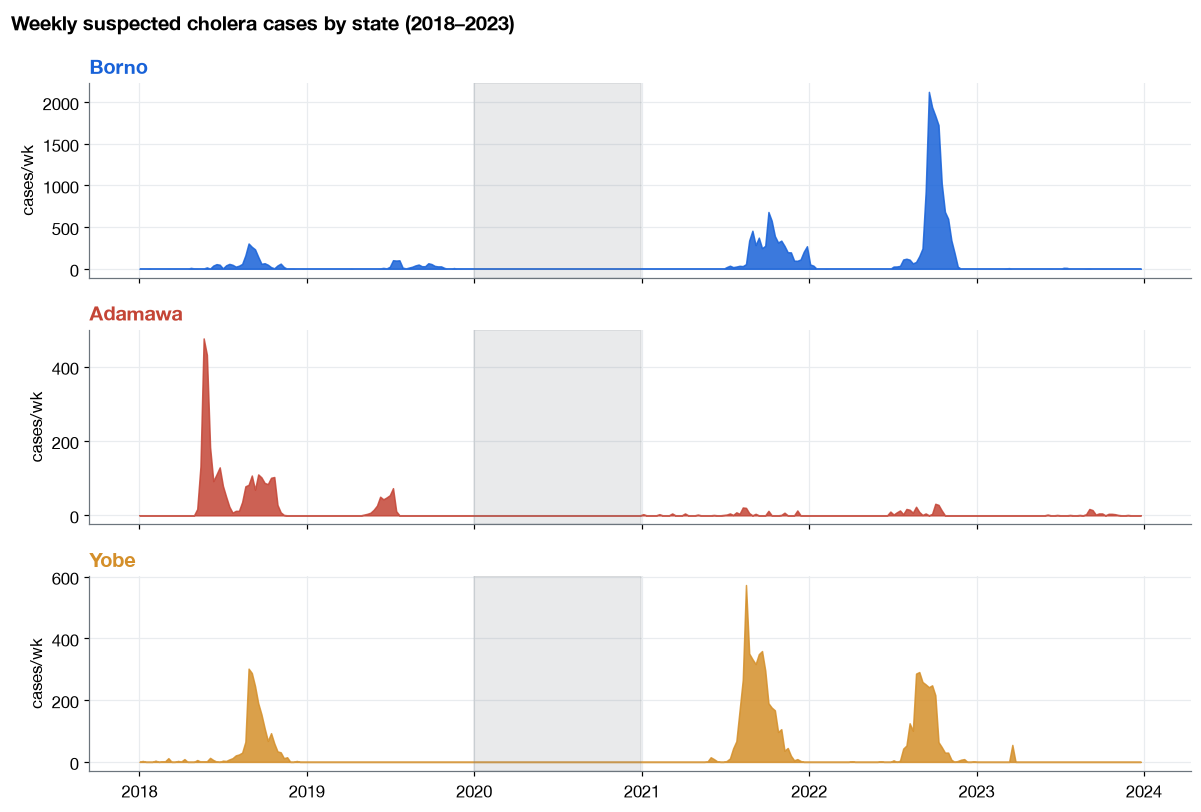
Figure 3.1: Weekly suspected cases by state. Outbreaks are sharp, seasonal and largely synchronised across BAY, with Borno driving the biggest peaks.
Outbreaks arrive as sharp, months-long waves rather than a persistent background — the signature an observational trigger is built to catch. The waves are broadly synchronised across the three states, so a state- or LGA-level trigger will often fire in several places within the same season.
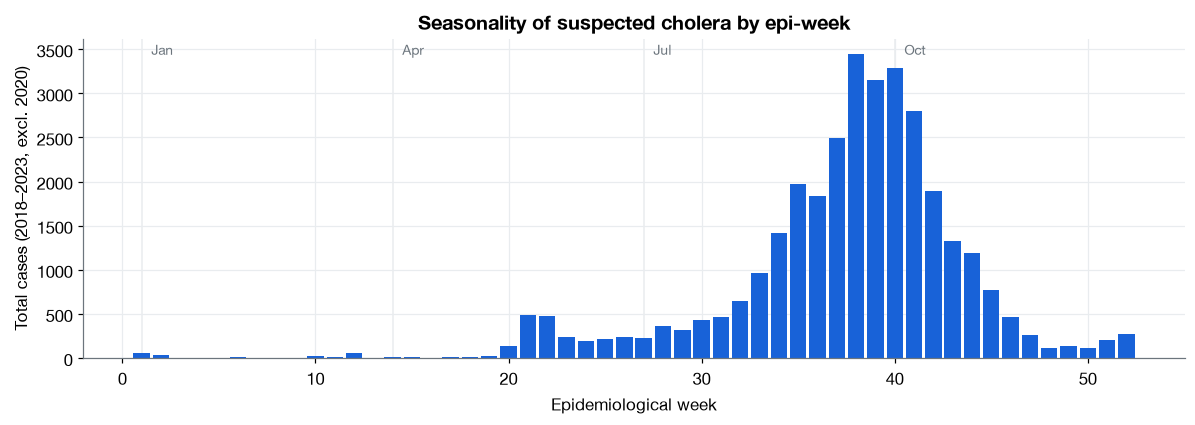
Figure 3.2: Mean suspected cases by epidemiological week, averaged across 2018–2023 (excl. 2020). Cholera peaks in the second half of the year, following the rains.
The burden concentrates in the second half of the year — the rainy season and its aftermath — though onset weeks vary between outbreak years. Seasonality is real but not tight enough to substitute for a live signal.
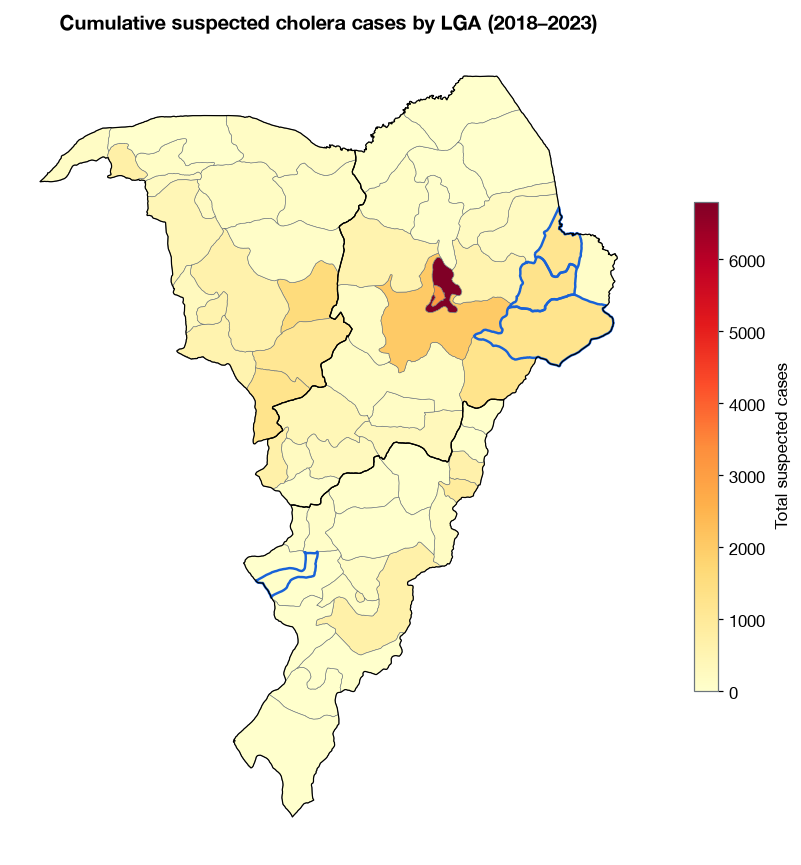
Figure 3.3: Total suspected cholera cases by LGA, 2018–2023. Burden concentrates in a handful of LGAs; the four priority LGAs are outlined.
Show code
top = ( llp.groupby(["ADM2_EN", "state"])["case"].sum() .sort_values(ascending=False).head(15).reset_index())fig, ax = plt.subplots(figsize=(10, 5.5))colors = [U.STATE_COLORS[s] for s in top["state"]]ax.barh(top["ADM2_EN"][::-1], top["case"][::-1], color=colors[::-1])ax.set_xlabel("Total suspected cases (2018–2023)")ax.set_title("Highest-burden LGAs")handles = [plt.Rectangle((0, 0), 1, 1, color=U.STATE_COLORS[s]) for s in U.STATES]ax.legend(handles, U.STATES, title="State", loc="lower right")plt.tight_layout()plt.show()
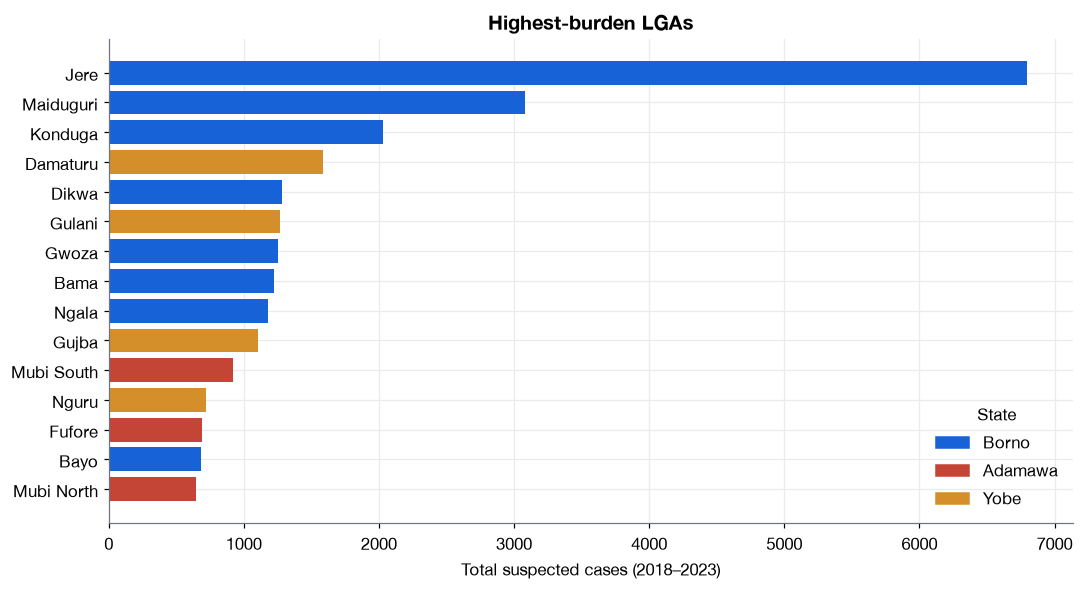
Figure 3.4: The 15 highest-burden LGAs, coloured by state. A small set of LGAs carries most cases — the basis for an LGA-level trigger.
A handful of LGAs — Maiduguri metropolitan LGAs and their neighbours in Borno above all — carry a large share of cases. Concentration like this is what makes an LGA-level trigger meaningful: the signal is not smeared evenly across 55 LGAs.
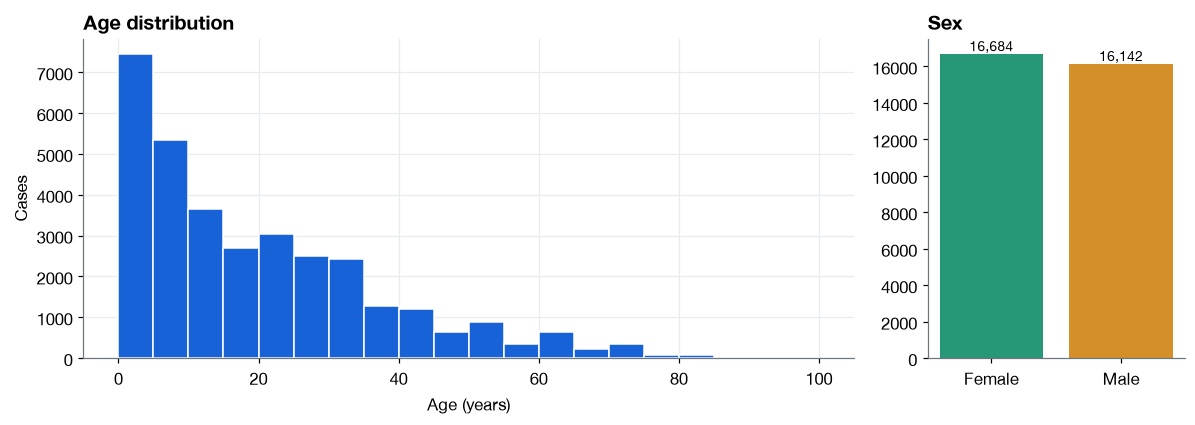
Figure 3.5: Age distribution of suspected cases (left) and sex split (right). Cholera here spans all ages, with a heavy under-5 and young-adult load.
Cases span all ages with a pronounced young-child and young-adult load, and a roughly even sex split — typical of a water-and-sanitation–driven epidemic in displacement-affected settings. These demographics don’t change the trigger design but confirm the outbreaks are broad community transmission, not a narrow sub-population.