This chapter defines a candidate trigger and shows how its pieces behave on the historical data. It reuses the design from the earlier BAY exploration and the DRC cholera framework, not an endorsed Nigeria framework — thresholds here are illustrative.
4.1 The candidate trigger
For each LGA and each epidemiological week, the trigger evaluates two conditions:
Per-capita percentile. Weekly cases exceed 0.01765% of the LGA’s population — the 99th-percentile weekly caseload (FRAC_THRESH_99 = 0.0001765).
Growth. Weekly cases are at least 4× the previous week (off a base of ≥5 cases, so a jump from 1→4 doesn’t fire).
A week is at alert if either holds. The trigger fires (activates) when alert level is sustained for 3 consecutive weeks — filtering one-week blips and confirming a real trajectory.
Why per-capita, and why zero-fill? A fixed case count means very different things in a 250k-person LGA and a 1.5m-person one, so the threshold scales with population. And percentiles are computed over the zero-filled weekly series (see Data quality) — percentiles taken only over weeks with cases sit far too high to ever fire.
Table 4.1: Per-capita 99th-percentile threshold translated into weekly cases, for the four priority LGAs and the largest-burden LGAs.
LGA
State
Population (2023)
Weekly-case threshold
Priority LGA
Bama
Borno
476,640
84
True
Ngala
Borno
418,531
74
True
Dikwa
Borno
186,974
33
True
Numan
Adamawa
147,496
26
True
Maiduguri
Borno
920,655
162
False
Fune
Yobe
539,767
95
False
Gwoza
Borno
487,808
86
False
Jakusko
Yobe
411,130
73
False
Damboa
Borno
408,825
72
False
Jere
Borno
372,865
66
False
A weekly threshold of roughly 30–100 cases (depending on LGA size) is what the percentile rule implies. The growth rule catches fast take-offs that haven’t yet cleared the absolute bar.
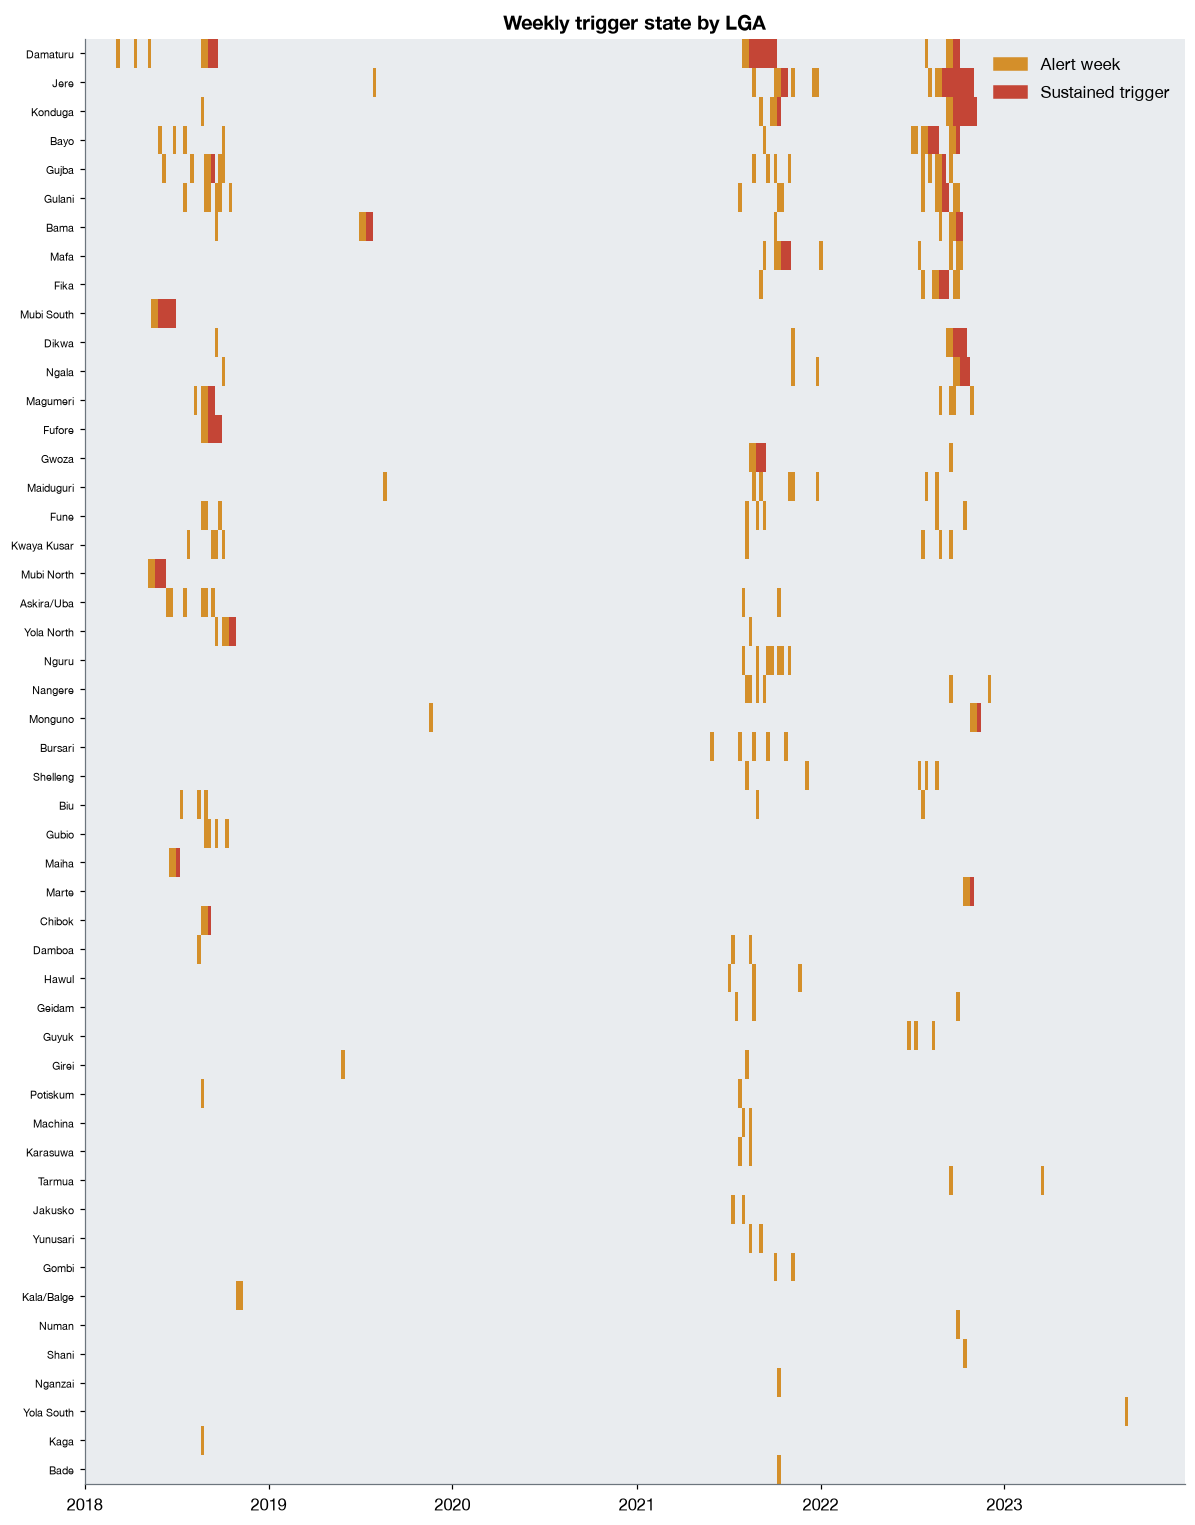
Figure 4.1: Weekly trigger state for every LGA that ever reaches alert. Amber = alert week; red = sustained (3-week) trigger. Activity clusters tightly in the 2018, 2021 and 2022 seasons.
Alerts are tightly clustered in the three outbreak seasons; between them the panel is quiet. That is the pattern a well-behaved trigger should show — dormant in calm periods, lit up during outbreaks.
4.3 Sensitivity to the design choices
How many activations does the trigger produce under alternative thresholds? Below we sweep the percentile, the growth multiple and the consecutive-week requirement, one axis at a time.
Table 4.2: LGA-year activations under alternative trigger parameters (one parameter varied from the baseline at a time). Baseline = p99 frac OR 4× growth, 3 weeks.
Configuration
LGA-year activations
Baseline (p99 frac, 4×, 3 wk)
27
Percentile → p95 frac
81
Growth → 3×
28
Growth → 5×
26
Window → 2 consecutive weeks
39
Window → 4 consecutive weeks
20
The trigger is most sensitive to the percentile (loosening to p95 sharply raises activations) and to the consecutive-week window (2 weeks is much noisier; 4 weeks much stricter). The growth multiple moves the count less. The baseline (p99 / 4× / 3 weeks) sits in a sensible middle — active in outbreak years, quiet otherwise — which is why the following chapters use it.